Elevate your trading strategy by analyzing the market!
Forex Trading Strategies
Each trade participated in, is governed by Forex trading strategies. From start to end, they serve as the backbone, guiding traders towards profits, while evading losses. In an environment as risky as Forex, traders need some sort of control over their trades. From picking the most dominant currency pair, to finding the right entry, a strategy plays a substantial role in ensuring victory is always in reach. While some traders prefer implementing short-term strategies that work on a minute or day-long basis, some choose to work with long-term plans that go on for weeks or months at a stretch. When implemented right, any strategy can yield well. Here are 4 types of analysis that play a substantial role in making profitable Forex trading strategies:
Fundamental Analysis
Foreign exchange is a field that relies heavily on analysis. To draft solid Forex trading strategies, that are immaculate in all aspects, requires accurate fundamental analysis. Currency values are heavily affected by economic, political and social conditions since these affect the supply and demand chain. These forces make currency trading a very volatile and risky endeavor. With fundamental analysis, however, a good grip can be established over price movements, ultimately resulting in better trades.
It is a method based on the market price of an instrument normally likes to reach to its ‘actual value’ or ‘basic value’. Fundamental analysis in Forex Trading is based on analysis of Macroeconomic factors. It helps to predict the price valuation of a currency and its market movement by analyzing current financial circumstances, government policy and public factors. Macroeconomic factors show the current status of the economical stability of a country depending on a particular region of the economy (interest rate, monitory policy, labor market, trade balance, etc.). They are released from time to time by a governmental authority and private agencies. After the publication of these factors, you can find volatility of the market (the volatility level depends on the factor importance). Most of the traders follow the fundamental factors in the financial markets. Important macroeconomic factors that influence price movements and the efficiency of Forex trading strategies are:
Interest Rates Announcement
Interest rates of a particular currency play the vital role for prices movement of currencies in the forex market. Central banks are the key player who announces the interest rate. Interest rates of a currency influence the flows of investment. As currencies represent a country’s economic strength, adjustment of interest rates affect the currency’s value in relation to one another. When central banks announce any changes in interest rates, forex market experiences volatile price movement. Precise assumption of central banks’ measures can improve the chances of successful trades.
Gross Domestic Product (GDP)
GDP is an important part of a country’s economy which describes the total market value of all goods and services produced by a country during in a specific year. Significant changes in GDP can cause a currency to get stronger or weaker with another currency in the Forex market and GDP release also makes them volatile. Hence, having an eye over the respective country’s GDP helps in creating apt Forex trading strategies.
Employment Indicators
Employment pointer replicates the overall strength of an economy or business condition. In order to identify how an economy is running, it is essential to know how many jobs are being created or destructed, what percentage of the workforce is actively working, and how many people are claiming unemployment. The growing speed of people’s income in a country is also important to measure the inflation.
Consumer Price Index (CPI)
CPI is the crucial factor of price inflation. It signifies the changes in the level of retail prices for the fundamental consumer market. Inflation is directly related to the purchasing power of a currency within its limits and affects its position on the international currency markets. When the economy grows in usual conditions, the increase in CPI can lead to an increase in normal interest rates which cause an increase in the prettiness of a currency.
Retail Sales
The retail sales are released on a monthly basis and are important to the forex trader because it shows the overall power of consumer spending and the achievement of retail supplies. Forex trading strategies should always take this factor in consideration. Consumer actions need to be observed carefully, in order to make the most out of Forex markets. The retail report is especially valuable because it is a particular factor of extensive consumer spending model that is adjusted for regular variables. Traders can use it to evaluate the instant path of an economy.
Balance of Payments
The Balance of Payments shows the ratio among the number of payments received from abroad and the number of payments going to abroad. In details, it shows the total foreign trade operations, trade balance, and balance between export and import, and transfer of payments. If incoming payment exceeds the outgoing payments the balance of payments is positive. The surplus is a positive factor for the growth of a currency.
Fiscal and Monetary Policy
Stabilization of the economy (e.g., overall employment, control of inflation, and an equitable balance of payments) is the main goals that governments attempt to achieve through adjustment of fiscal and monetary policies. Fiscal policy relates to taxes and expenditures, monetary policy to financial markets and the supply of credit, money, and other financial possessions. Besides these economic indicators, there are social factors and government policies that are also fundamental indicators which help forex traders to find out the market movements and trends. You can find this indicators release on our economic calendar page.
You can also find the time and date with effect about fundamental indicator on Economic Calendar
Technical Analysis
Trends speak volumes in foreign exchange. The process of devising Forex trading strategies becomes simpler when you can make decisions based on trends. Technical Analysis is based on knowledge about price movements, volumes and price action of past behavior of the markets. It is a technique used to forecast the future direction of the market. A graphical chart is used to analyze the market technically.
Technical Analysis is one of the major instruments for predicting the market manners. It is an effective tool for investors and is always becoming more accepted by the traders. With the use of fundamental analysis and technical analysis combined can make the difference in executing profitable trades.
Following tools can be used for technical analysis:
- Technical Indicators (eg- Moving Average, Bollinger Brand, RSI, Stochastic etc)
- Charts Patterns
- Support & Resistance
- Continuation Patterns
- Mathematical Indicators
- Fibonacci
Fibonacci Analysis
With trends becoming important criteria for devising Forex trading strategies, the Fibonacci tool works best in foreign exchange. While the Fibonacci ratios have been adapted to various technical indicators, their maximum use in technical analysis remains the measurement of correction waves.
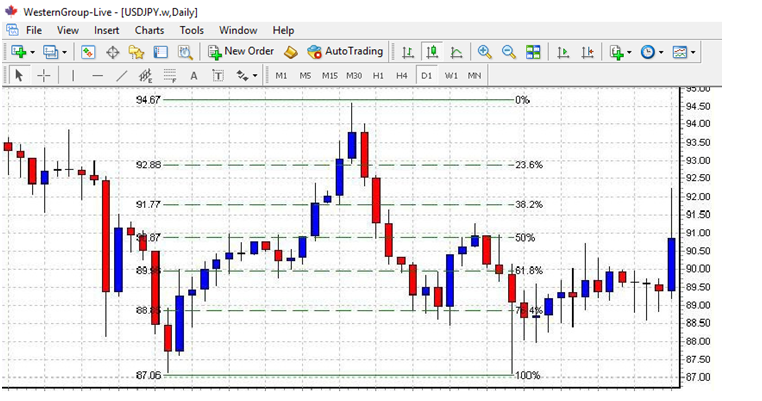
Fibonacci Price Retracements
To find the Fibonacci retracement levels, the first step is to figure out the recent significant Swing Highs and Swings Lows. For downtrend, you need to click on the Swing High and drag the pointer to the recent Swing Low. For uptrend, do the opposite i.e. click on the Swing Low and drag the pointer to the recent Swing High. A retracement is a move in price that “retraces” a portion of the previous move. Usually the common 3 Fibonacci levels are – 38.2%, 50%, and 61.8%. In downtrend market Fibonacci price retracements are confirmed from a prior low-to high swing to identify possible support levels as the market pulls back from a high. And in uptrend market, retracements are run using the same ratios from a prior low-to-high swing, looking for possible resistance levels as the market bounces from a low.

Fibonacci Price Extensions
Fibonacci price extensions are used by traders to determine areas where they will wish to take profits in the next leg of an up-or downtrend. The percentage extension levels are plotted above or below the previous trend move as horizontal lines. The most popular extension levels are 61.8%, 100.0%, 138.2% and 161.8%.
Major indicators
With the right indicators in place, and equipped with strong Forex trading strategies, catching profitable trends will be no arduous task.
Stochastic Oscillator
The stochastic oscillator is used to recognize the position of a financial instrument is whether in an oversold or overbought level.
The technique used is the main and signal lines of the indicator together with the overbought and oversold levels; for example, the 70 level (overbought) and the 30 level (oversold), as shown in the figure below. These two levels can be adjusted accordingly based on your trading style.
Some traders also apply this indicator using parameters such as the M and W shapes.
An overbought condition happens where both the main and signal line oscillates close to the 70 level, forming a potential M shape.
In contrast, an oversold condition happens where both the main and signal line is below the 30 level, forming a potential W shape and highlighting that a bullish trend has a great chance to prevail.

Relative Strength Index (RSI)
This indicator recognizes volatility level of a financial instrument. The criteria are solely based on one signal line together with an oversold and overbought level, which by default is the 70 level (overbought) and the 30 level (oversold), as shown on the figure below.
In the occasion that bearish pressures are likely to be far greater than bullish ones, the signal line will bypass or retrace below the 70 level, which is the indication of downtrend scenario and has a greater chance of prices going down.
Alternatively, an uptrend formation will happen when the signal line breaks below or retraces at the 30 level.

Zig Zag
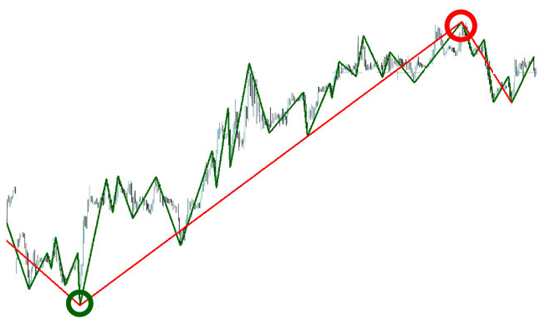
The Zig Zag indicator aims to recognize the trend reversals, with the bearish or bullish trend forming from the combination of two or more Zig Zag lines.
A downtrend confirmation takes place when both the Zig Zag lines intersect to the upside, signaling that a bearish trend reversal has a greater chance to occur.
Alternatively, a downside intersection signals that a bullish trend reversal has a greater chance to occur.

Blog
The Myths Of Trading You Must Remove From Your Mind
There are numerous misconceptions and incorrect assumptions that surrounding trading. These myths are held both by aspiring traders as well as the public. Not only are they untrue, they are hurtful both to you as a trader and your chances off success but also to the reputation of trading in...
Happy New Year 2026!
🎉✨ Welcome 2026 with New Hopes & New Opportunities! ✨🎉As we step into 2026, let’s unwrap a year filled with growth, success, and smart financial decisions. 📈💼May this New Year bring you profitable trades, stronger strategies, and endless possibilities in the world of trading.🌟 New Year, New Goals, New Wins!Thank...


